ApoB vs LDL-C as a Cardiovascular Risk Biomarker
Particle count, not cholesterol mass, better predicts heart attack and stroke risk.
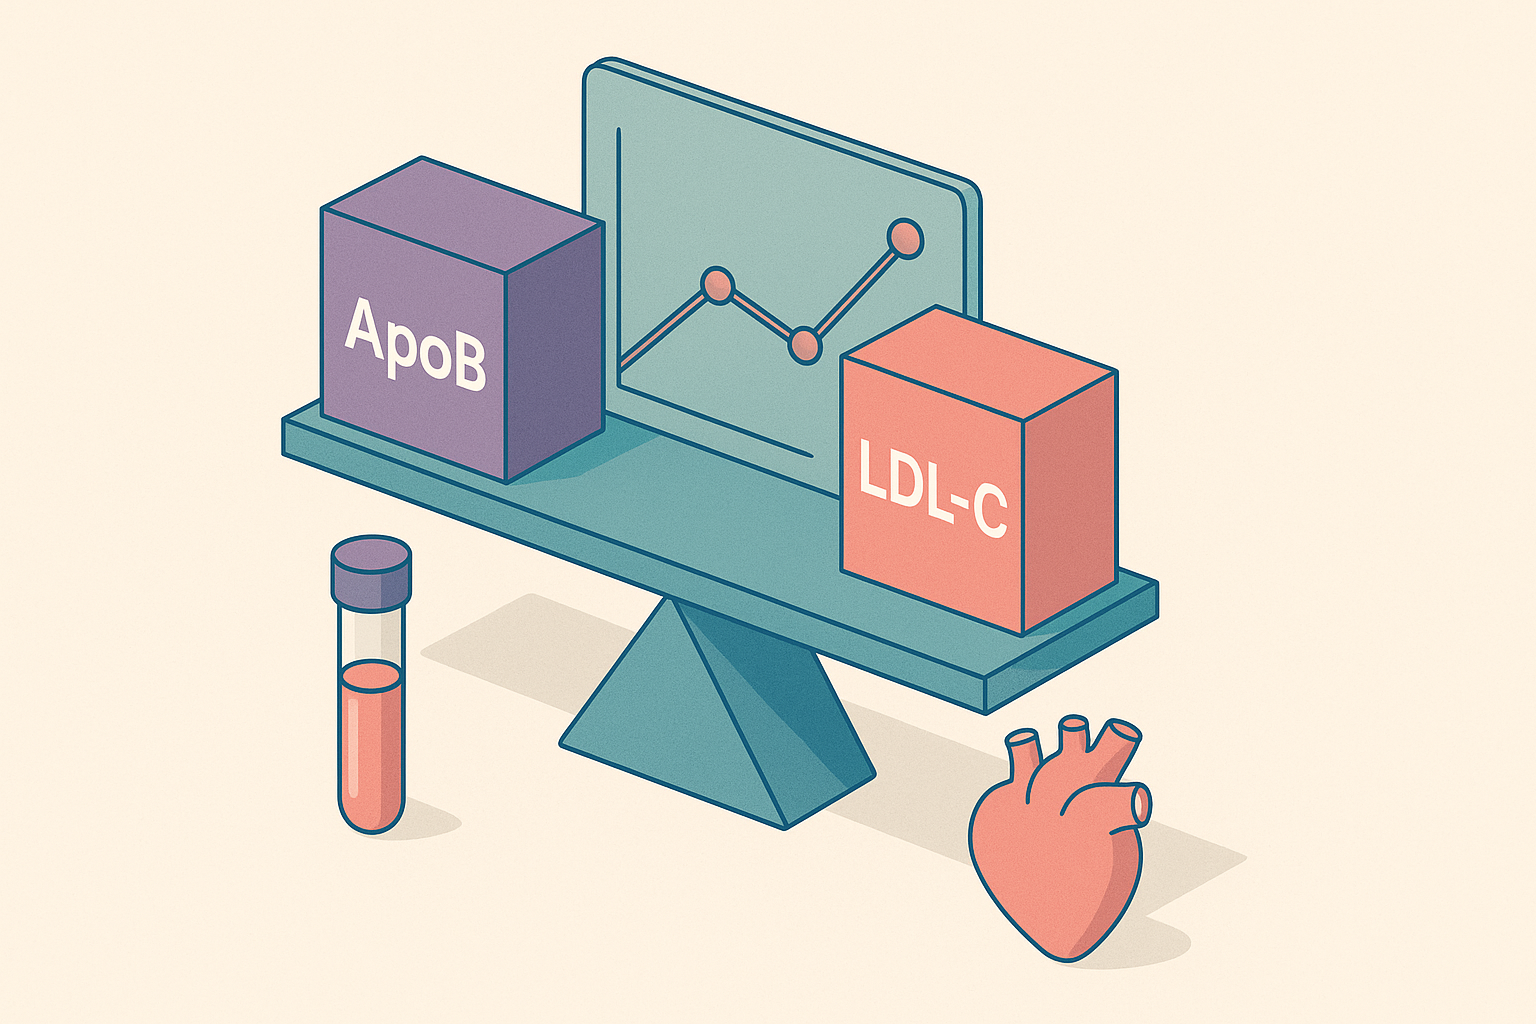
LDL-C measures how much cholesterol sits inside your LDL particles. ApoB counts the particles themselves, including the LDL, VLDL, IDL, and Lp(a) that LDL-C either misses or blends together. That difference matters more than most standard lipid panels let on, because the evidence built up over the last two decades points to particle count, not cholesterol mass, as the thing that actually predicts heart attacks and strokes. LDL-C should stop being the primary number doctors lean on. The data below explains why.
Why particle count, not cholesterol mass, drives atherosclerotic risk
Atherosclerosis starts when a lipoprotein particle slips into the wall of an artery and gets stuck there. Each one of those particles, whether it's an LDL, a VLDL remnant, an IDL, or an Lp(a), carries exactly one molecule of apolipoprotein B. Count the apoB, and you've counted every particle capable of starting that process. Measure LDL-C instead, and you've measured something else entirely: the total weight of cholesterol those particles happen to be hauling around at the moment of the blood draw.
The two numbers would line up if every particle carried the same amount of cholesterol. They don't. Cholesterol content per particle swings widely from person to person, shaped by insulin resistance, how the liver handles lipid traffic, low-grade inflammation, diet, and genetics. A small, dense LDL particle carries far less cholesterol than a large, buoyant one, even though both count as one apoB. So a person can walk around with a normal LDL-C reading while their blood is dense with small particles and an elevated apoB, a pattern common enough that it shows up again and again in the outcome data below.
VLDL and its remnants complicate the picture further. Each one is a single apoB particle, but the remnants left behind after VLDL sheds triglyceride are thought to be more atherogenic than an LDL particle on a per-particle basis. LDL-C never sees these particles at all. Non-HDL-C at least captures their cholesterol cargo, since it includes the cholesterol carried by all atherogenic lipoprotein fractions, but it still can't tell you how many particles are actually circulating. Lp(a) carries the same single apoB per particle and adds to the atherogenic pool, again in a way LDL-C doesn't reliably register.
Here's the mechanism in plain terms: if plaque starts with a particle getting trapped in the artery wall, then the number of particles in circulation is the more honest measure of exposure than the mass of cholesterol they happen to be carrying that day.
What the large outcome studies show when apoB and LDL-C are compared directly
The AMORIS study, which followed a large national population, is often cited as an early large-scale demonstration that apoB outperforms LDL-C at predicting fatal myocardial infarction. And the advantage was sharpest in the lower half of the LDL-C range, exactly where a standard panel would tell a patient they're in the clear.
Subsequent large prospective cohort work in similar populations has continued to find that elevated apoB independently predicts cardiovascular events, a pattern that holds across long follow-up periods.
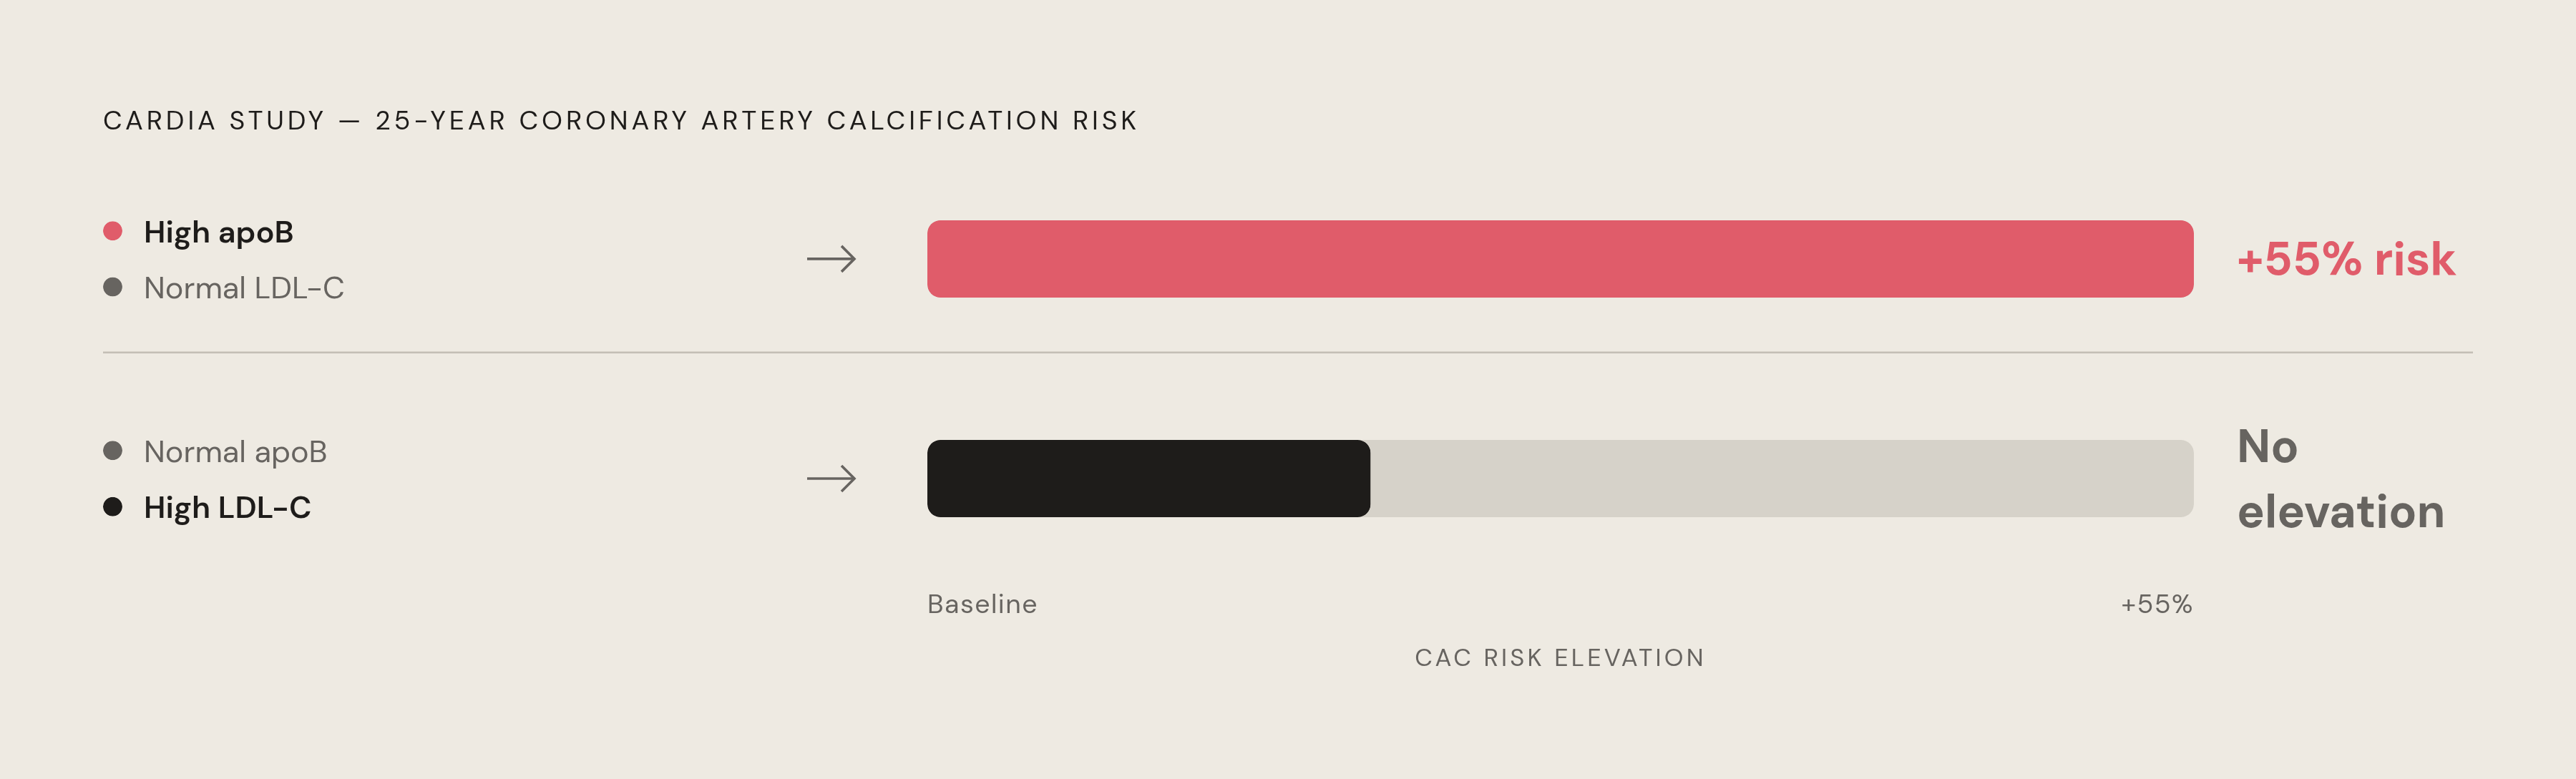
The CARDIA study offers maybe the cleanest natural experiment on record. Young adults with high apoB but normal LDL-C carried a 55% higher risk of developing coronary artery calcification twenty-five years later. Young adults with the opposite pattern, high LDL-C but normal apoB, showed no such elevated risk. Same cholesterol panel category on paper, completely different outcomes twenty-five years out.
FOURIER, a randomized trial of lipid-lowering therapy, has been cited as evidence that apoB tracks treatment benefit more closely than LDL-C does. That matters for a separate reason: apoB isn't just better at flagging risk beforehand, it's better at telling a clinician whether the drug is doing its job.
A systematic review published in the Journal of Clinical Lipidology, covering literature through September 30, 2024, pulled together fifteen discordance studies totaling 593,354 participants. ApoB beat LDL-C in all nine studies that made the comparison. LDL particle number outperformed LDL-C in two of three comparisons. ApoB beat non-HDL-C in seven of nine. The ATTICA study out of Athens followed 3,042 adults free of cardiovascular disease starting in 2002, with 1,988 completing twenty years of follow-up by 2022; elevated apoB independently predicted twenty-year risk regardless of non-HDL-C or Lp(a) levels, though the effect showed up specifically when LDL-C was also elevated. The authors concluded that particle number, not cholesterol content, is the more durable long-term predictor. A 2025 UK Biobank analysis found apoB beating LDL particle number whenever the two disagreed, with elevated risk showing up at discordance levels as small as 2%.
Cohort studies, case-control designs, a randomized trial, a systematic review: different methods, same conclusion. When apoB and LDL-C disagree, apoB carries the signal. LDL-C doesn't get a vote in that disagreement anymore, not credibly.
When the two markers tell different stories, and who this affects most
Discordance is the technical term for what happens when apoB and LDL-C point in different directions for the same patient: one elevated, the other apparently fine. It's not a rare edge case. Roughly 20% of people carry a normal LDL-C alongside an elevated apoB, meaning their actual risk runs higher than the standard lipid panel says it does.
Triglycerides drive a lot of this. Discordance prevalence runs at 39.7% among patients with triglycerides at or above 1.7 mmol/L, compared to 22.1% at lower triglyceride levels. VLDL and remnant particles each carry one apoB molecule, contributing to the total apoB count in a way that LDL-C, which measures cholesterol mass rather than particle number, does not directly capture.
Several patient groups show this pattern more than others. People with metabolic syndrome or type 2 diabetes turn up again and again in the discordance data; a 2025 systematic review in Diabetes, Obesity and Metabolism found these patients often hit their LDL-C targets while apoB and non-HDL-C stay stubbornly high. Metabolic dysfunction more broadly associates with what's called positive discordance, where apoB runs higher than LDL-C would predict. Older age, male sex, and Hispanic ethnicity show up as additional correlates. Statin-treated patients deserve particular attention here: a patient can hit their LDL-C target on treatment while meaningful particle burden lingers underneath, invisible to the test that's supposedly confirming success.
Familial hypercholesterolemia adds another layer. A retrospective cohort of 424 genetically confirmed FH patients, median age 51, just over half female, followed for a median of 9.1 years, recorded 61 cardiovascular events. Patients with an apoB-to-LDL-C ratio at or above 0.31 g/mmol had an event rate of 27.6%, versus 11.8% below that threshold. As a retrospective cohort study, these findings carry the usual caveats about causality and generalizability, but a gap that size is hard to wave away.
A point raised in JAMA Cardiology deserves stating plainly: limiting apoB testing to patients who already look metabolically at-risk will still miss a meaningful share of people with discordantly elevated apoB. Screening by risk profile first is a filter with holes in it. And apoB holds up better than LDL-C when LDL-C itself is very low, a common situation in patients on aggressive treatment, because LDL-C is typically a calculated rather than directly measured value and that calculation becomes less reliable at low concentrations.
Practical advantages of measuring apoB that go beyond predictive accuracy
ApoB comes from a direct immunoassay. LDL-C, by contrast, is usually a calculated value, derived from total cholesterol, another lipoprotein cholesterol measure, and triglycerides run through the Friedewald equation. That means LDL-C inherits every error baked into those three inputs, compounded.
Fasting status is where this shows up most in daily practice. Triglycerides shift after a meal, and since the Friedewald equation leans on triglyceride values, a non-fasting sample makes the resulting LDL-C figure less trustworthy. ApoB doesn't care whether the patient ate breakfast.
The assay itself is standardized and widely available, with solid reproducibility across labs, so the infrastructure to run it already sits in most clinical settings. It also does double duty: useful before treatment starts as a risk marker, and after as a check on whether therapy actually reduced the atherogenic particle burden, which is exactly what the FOURIER data suggested it tracks better than LDL-C does. None of this requires new equipment. It's a standard blood draw. What's standing in the way of wider use isn't technical difficulty. It's the weight of convention in how lipid panels have been ordered for decades, and habits that old don't move for evidence alone.
Where international guidelines currently stand on apoB
The 2019 ESC/EAS dyslipidaemia guidelines already acknowledged apoB as a more accurate risk marker and included it as a secondary treatment target, specifically flagging situations where LDL-C may underestimate risk. The same guidelines concluded apoB is a better index of whether therapy is working than either LDL-C or non-HDL-C.
The 2025 ESC/EAS Focused Update revisits treatment recommendations based on evidence published since 2019, through March 31, 2025, which signals this is an active revision, not a closed question.
Even so, LDL-C remains the primary target across most national guidelines and the default test in routine care. That's the wrong resting place for the evidence to have landed. ApoB is gaining ground as a secondary or confirmatory measure, particularly for high-risk patients and discordant cases, but it hasn't displaced LDL-C as the anchor test. The Journal of Clinical Lipidology review's authors went further than most guidelines currently do, stating plainly that apoB should be the primary clinical measure for estimating cardiovascular risk from apoB-containing lipoproteins. That's stronger language than what most health systems have adopted, and the stronger language is the one the data actually backs.
Guideline change moves slowly, worth saying honestly. Test-ordering habits are hard to shift, and LDL-C carries decades of accumulated evidence behind it, even if that evidence answers a narrower question than apoB does. This is a live argument playing out in cardiology, not a settled consensus. But among the researchers actually publishing this data, the emerging view treats LDL-C as still fine for population-level screening while treating apoB as the sharper tool the moment the question turns to one patient's real risk, or whether their treatment is working.
How to read an apoB result alongside LDL-C in practice
When the two markers agree, both elevated or both normal, they reinforce each other, and LDL-C works fine as a stand-in. The interesting case, and the one worth paying attention to, is when they don't.
LDL-C normal, apoB elevated (positive discordance) is the pattern that matters most clinically, because a standard panel waves this patient through as low risk while the particle count says otherwise. This is usually driven by small dense LDL, VLDL remnants, or the metabolic factors described above, and it's the exact blind spot that ordering LDL-C alone creates.
LDL-C elevated, apoB normal (negative discordance) runs the opposite direction: fewer particles than the LDL-C number implies, each one carrying more cholesterol, the classic large buoyant LDL phenotype. Risk here likely runs lower than the LDL-C number alone suggests, though not down to zero.
ApoB testing earns its keep most clearly in patients with metabolic syndrome, type 2 diabetes, high triglycerides, obesity, or those on statin therapy who've already hit their LDL-C target but may still carry residual particle burden underneath it. The CARDIA finding is the cleanest way to hold the whole idea in mind: high apoB with normal LDL-C carried a 55% higher risk of coronary calcification twenty-five years out, while high LDL-C with normal apoB carried no such elevated risk. The particle count was the signal. The cholesterol mass was noise.
None of this replaces the rest of a cardiovascular risk assessment. ApoB adds a fuller picture of atherogenic burden, but it sits alongside blood pressure, glucose, family history, and inflammatory markers, not in place of them. For anyone reviewing their own lipid panel, asking a clinician to add apoB to the standard LDL-C test is a reasonable ask, and an increasingly available one, particularly for anyone carrying the metabolic risk factors tied to discordance above.
Sources
- Concordance‐discordance between apolipoprotein B and lipid biomarkers in predicting 20‐year atherosclerotic cardiovascular disease risk: The ATTICA study (2002–2022) - Giannakopoulou - 2025 - European Journal of Clinical Investigation - Wiley Online Library
- ApoB, LDL-C, and non-HDL-C as markers of cardiovascular risk - ScienceDirect
- ApoB, LDL-C, and non-HDL-C as markers of cardiovascular risk - PubMed
- Why ApoB is more accurate than LDL cholesterol
- lipidjournal.com
- dom-pubs.onlinelibrary.wiley.com