Continuous Glucose Monitoring in Metabolically Healthy Adults
Continuous glucose monitors reveal hidden glucose swings in metabolically healthy adults.
Fasting glucose and HbA1c have told the story of metabolic health for decades, and both tests are limited in ways most patients never hear about. Fasting glucose captures a single number at a single moment, usually first thing in the morning after eight or more hours without food. HbA1c averages blood sugar over roughly two to three months by measuring how much glucose has attached to hemoglobin in red blood cells. Neither test sees what happens between those points, such as the climb after a carb-heavy lunch, the overnight drift, the spike during a hard workout or a stressful meeting.
Normoglycemia is defined, at the population level, as an HbA1c below 5.7% and a fasting glucose below 100 mg/dL. Those cutoffs work fine for screening large groups, but they say nothing about an individual's daily glucose dynamics. A person can land comfortably inside both reference ranges and still ride a rollercoaster of glucose excursions all day that neither test would ever catch. Continuous glucose monitoring closes that gap, and what it reveals about metabolically healthy adults is the subject of this piece.
How the CGM sensor works in practice, and what it actually measures
CGM sensors don't measure blood glucose directly. They measure glucose in interstitial fluid (ISF), the thin layer of fluid surrounding cells just beneath the skin. That distinction matters because ISF glucose lags behind blood glucose, particularly when levels are changing fast, which is part of why rate-of-change data needs to be read with some caution rather than taken as an instantaneous truth.
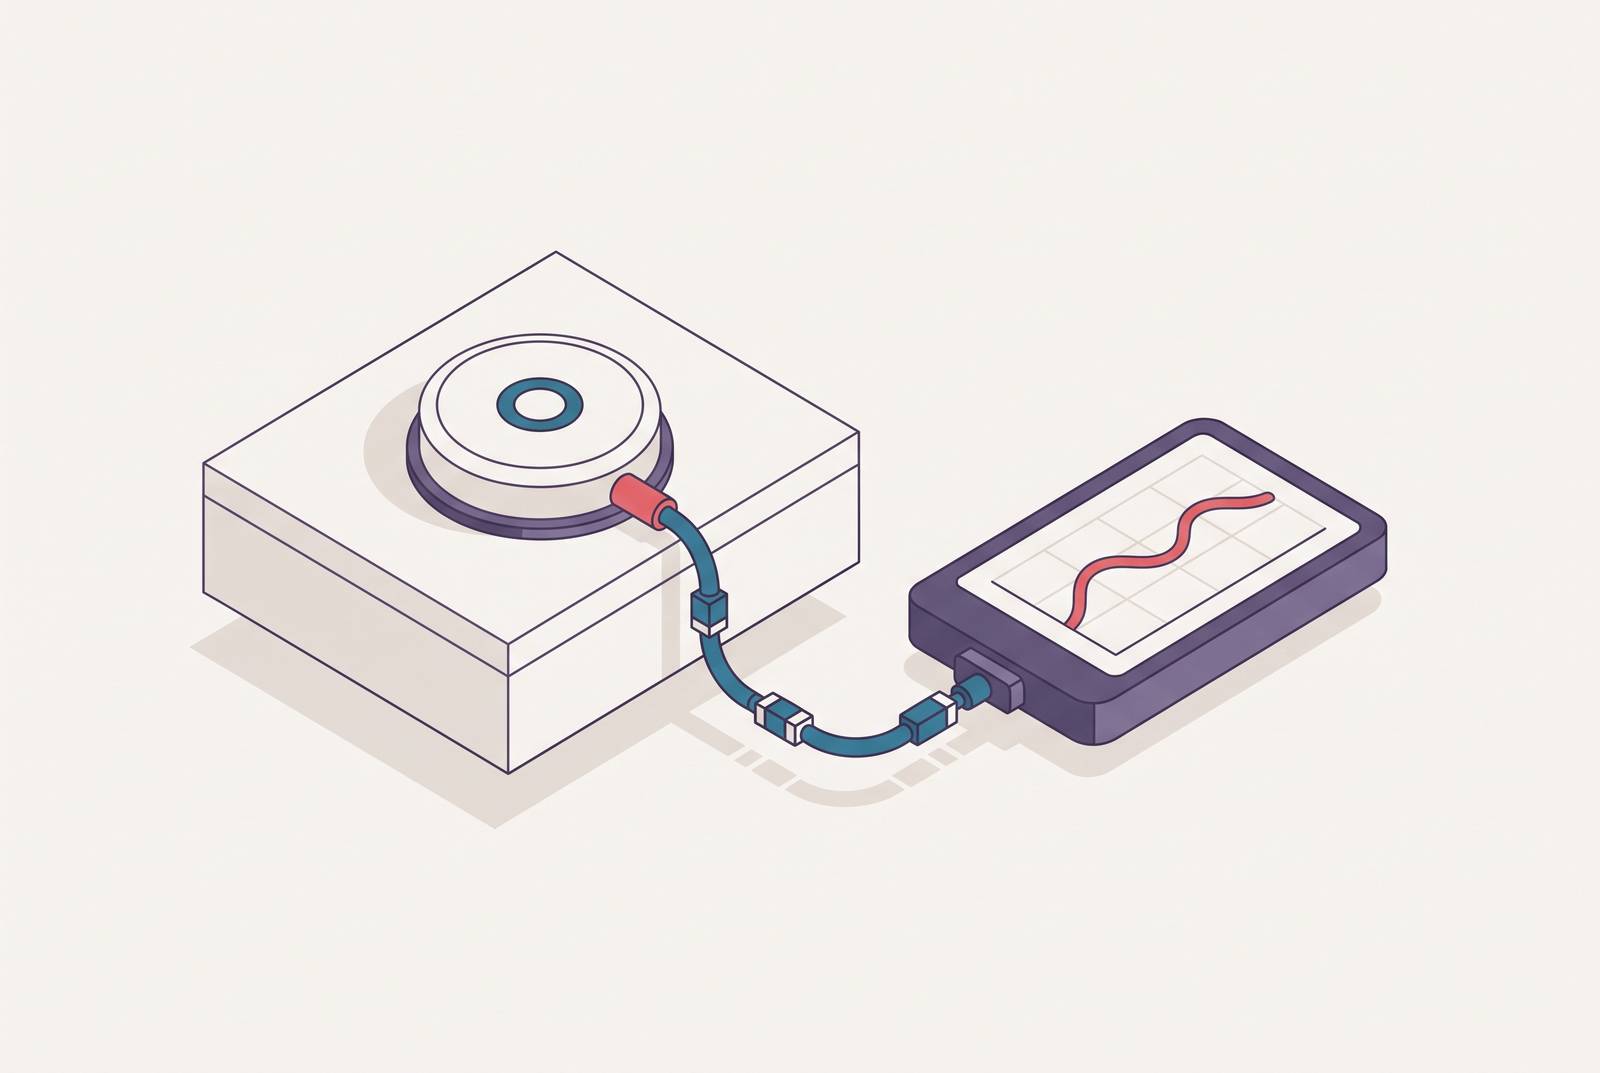
The devices themselves are simple to wear and unglamorous in design: an adhesive patch, usually on the back of the upper arm, holding a small filament that sits just under the skin for up to 14 days. The CGM-HYPE study, run at Heinrich-Heine University in Düsseldorf, used the FreeStyle Libre 3 for exactly this kind of continuous wear. An electrochemical reaction inside the sensor generates a current proportional to glucose concentration, and the device converts that current into a continuous glucose profile, typically updated every few minutes.
From that stream of readings, several metrics fall out. Mean glucose is the average across the wear period. Time in range (TIR) and time above range (TAR) describe the share of time spent within or above defined glucose bands. Glucose excursion measures how far and how fast a value rises after a stimulus like a meal or a workout. Rate of change tracks the speed of that rise or fall, in milligrams per deciliter per minute. The CGM-HYPE study introduced a newer metric, Glucose Recovery Time to Baseline (GRTB), which measures how long it takes glucose to return to its starting point after a spike.
None of these numbers are perfectly precise. Sensor accuracy gets reported as Mean Absolute Relative Difference (MARD), a measure of how far sensor readings deviate from a reference blood glucose value. Lower MARD means tighter accuracy, but no CGM on the market today reads with zero error. That imprecision matters for how a reader should treat any single number the device produces. CGM is a monitoring tool that shows patterns rather than making diagnoses. It shows patterns. It does not, on its own, diagnose disease.
Large-cohort research filling the normative data gap for healthy adults
Until recently, the field simply didn't have good data on what normal CGM patterns look like in people without diabetes. Studies before 2024 tended to be small, often under 100 participants, frequently excluded people with obesity, and required manual daily calibration that introduced its own noise. That's according to the authors of the Framingham Heart Study's CGM paper, published in JCEM in 2025, who used that gap as the starting point for their own work.
The Framingham study itself is the largest thing to happen in this space. Researchers led by Spartano and colleagues enrolled 1,175 participants from the Framingham Heart Study cohort and had each wear a Dexcom G6 Pro for at least seven full days, with data collected between September 2022 and the end of December 2023. Published in JCEM, Volume 110, Issue 4 (April 2025, pp. 1128 to 1134), it stands as the first large, community-based look at glucose dynamics in a broadly representative adult population, extending beyond a clinical sample selected for narrow criteria.
Smaller, more controlled studies have filled in the mechanistic detail that a cohort study like Framingham can't provide. The CGM-HYPE study, mentioned above, enrolled just 10 healthy young adults but ran them through nine standardized interventions over 14 days of Libre 3 wear, letting researchers isolate the glucose effect of a single food, exercise type, or stressor with a precision a 1,175-person cohort study can't match. A 2025 study compared 34 young adults (ages 20 to 35) against 27 older volunteers (ages 60 to 75). Arce and colleagues published CGM-derived glucose profiles in young adults in May 2026, in the Journal of Diabetes Science and Technology. Large observational cohorts and small controlled trials are answering different halves of the same question, and the field needs both.
What healthy adults' glucose looks like on a CGM trace
The Framingham finding is the one to sit with. Roughly 20% of middle- and older-aged adults who met the standard criteria for normoglycemia, an HbA1c under 5.7% and fasting glucose under 100 mg/dL, spent more than 2% of their monitored time above 180 mg/dL, a threshold defined as hyperglycemic. Among people classified as prediabetic, that prevalence roughly doubled. Being told your labs are normal, in other words, does not mean your glucose sits flat all day. It means your fasting number and your two-to-three-month average look fine. What happens in between is a different story, and CGM is the only tool that tells it.
Arce et al.'s 2026 work adds a sex dimension to this picture: the study found that glucose variability indices differed between the two groups, suggesting that the shape of a person's glucose curve follows patterns linked to individual characteristics.
Köhlmoos and Dittmar's age-comparison study found something more nuanced. Both the 20-to-35 group and the 60-to-75 group maintained broadly healthy glycemic profiles, though the two age brackets showed differences in their glucose patterns. Older, healthy adults aren't necessarily more erratic, but age-related shifts in glucose dynamics were apparent.
Separate research takes a different angle, proposing a normative reference for rate of change rather than for absolute glucose level: roughly ±2 mg/dL per minute over a 15-minute window. The proposed reference describes the typical velocity of glucose movement rather than its absolute position. Think of it as an analog to the familiar 70-140 mg/dL static range, except this one describes velocity rather than position. Put all of this together, and a clear picture forms: a healthy CGM trace in a person without diabetes is not flat. It has a characteristic shape, a normal amount of variability, and individual differences in that variability that a fasting test or an HbA1c simply cannot see.
The effects of diet, exercise type, and psychological stress on the glucose trace
The CGM-HYPE study's design makes it possible to isolate exactly which everyday actions move glucose, and by how much. Ten healthy young adults went through nine standardized challenges, including specific foods, anaerobic exercise, aerobic exercise, and a validated psychological stress protocol called the Trier Social Stress Test (TSST). Researchers tracked glucose for four hours after each challenge and measured Glucose Recovery Time to Baseline for each one.
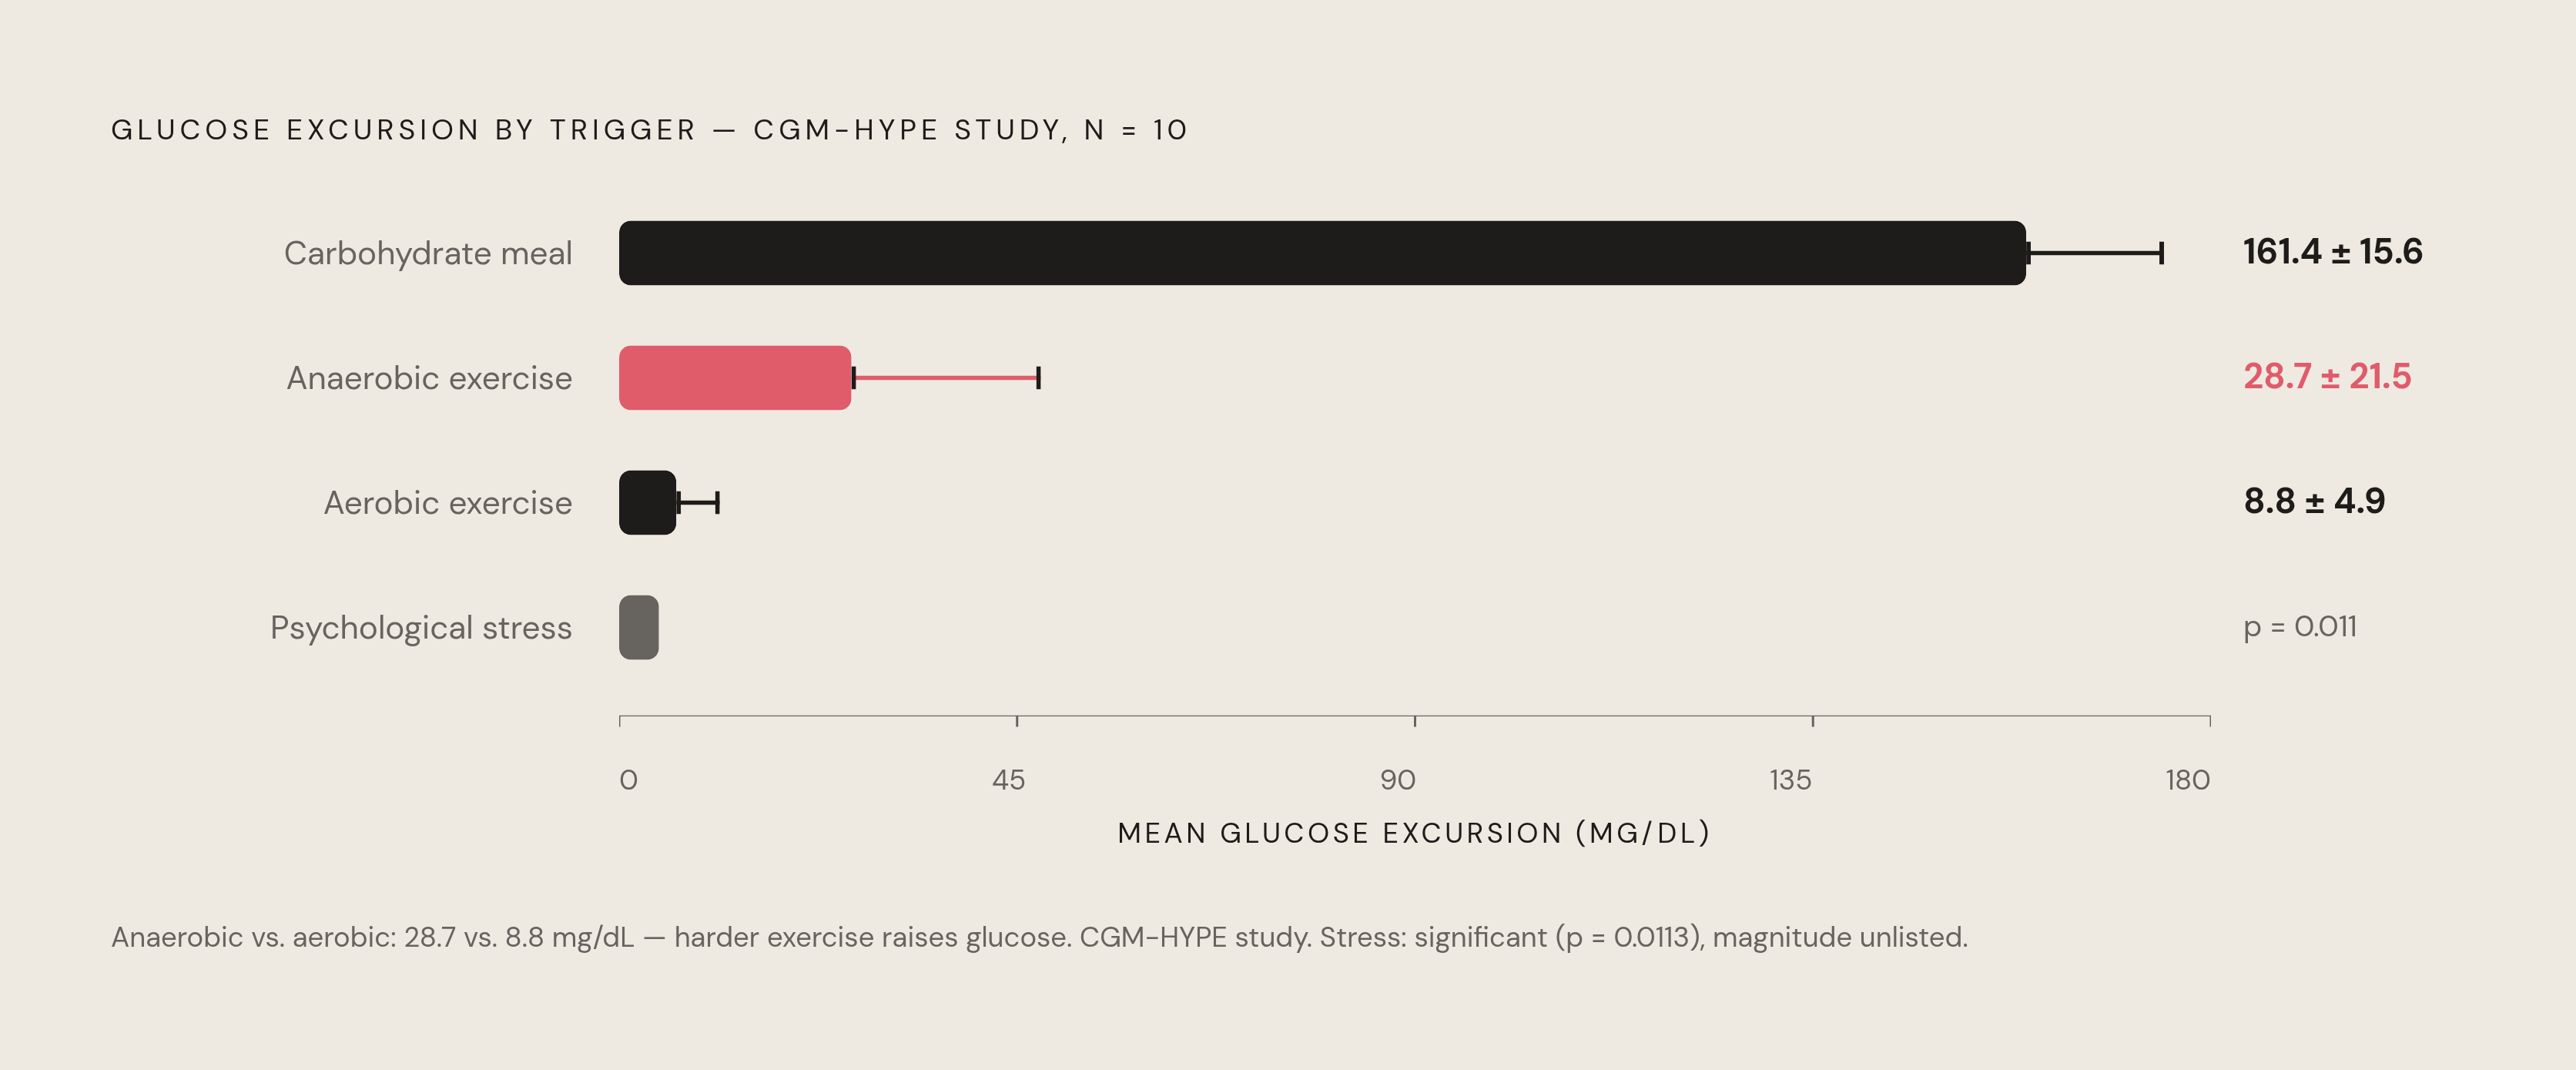
Food with heavy carbohydrate content produced the largest rise, with a glucose increase of 161.4 ± 15.59 mg/dL. That tracks with the broader pattern seen across the CGM literature linking carbohydrate intake to glycemic variability. None of this is surprising on its face. Carbs raise glucose. What's more interesting is what happened with exercise.
Anaerobic exercise, the kind involving sprints or heavy resistance training, produced a significantly larger glucose excursion (28.7 ± 21.46 mg/dL) than aerobic exercise did (8.8 ± 4.91 mg/dL, p = 0.0228). That result runs against the instinct that "harder" exercise should lower glucose more. It doesn't, at least not immediately. Anaerobic effort triggers a burst of catecholamines and a release of stored glycogen from the liver and muscles, which pushes glucose up in the short term before it comes back down. Anyone watching a CGM trace spike during a set of heavy squats is watching a normal stress response play out, not a metabolic problem.
Stress alone, without any food or exercise involved, moved the needle too. The TSST produced a statistically significant shift in baseline-corrected glucose over time (p = 0.0113). Psychological stress is a glucose driver that a fasting test has no way of ever detecting; it simply doesn't exist as a variable in a single morning blood draw. The CGM-HYPE sample size, just 10 participants, means none of this should be read as a clinical prescription. Its value lies in the controlled isolation of each variable.
There's a practical payoff buried in a systematic review published in Cureus in October 2025, which looked at CGM's use in personalizing exercise timing. Initiating a walk before an individual's typical postprandial glucose peak significantly reduced postprandial glucose, insulin, and C-peptide levels. That kind of personalized timing is only possible once someone has real-time glucose data in front of them. A generic recommendation to "walk after meals" becomes something sharper and more individual: walk at minute 22, because that's where this person's curve tends to turn upward.
The limits of CGM data
Interstitial fluid lag is the first limit to name again here, because it directly affects how a rate-of-change arrow should be read. When glucose is changing quickly, the ISF reading trails the true blood glucose value, so an arrow pointing sharply up or down carries more uncertainty than the same arrow during a stable period.
Sensor accuracy adds a second layer of imprecision. Stelo carries a MARD of 8.3%, Lingo is 9.3%. Those numbers mean individual readings carry real measurement error, and a single unusually high or low number is not, by itself, a clinical event worth reacting to.
There's also no established normative time-in-range target for healthy, non-diabetic adults. The familiar 70-180 mg/dL TIR band was built specifically for diabetes management. Part of what the Framingham study contributes is showing that applying those diabetes-oriented thresholds to normoglycemic adults reveals more time above range than most people would expect. But what the "correct" TIR should be for someone without diabetes remains an open question, not a solved one.
The Cureus systematic review, which pulled together seven studies, lands on a fair and sober conclusion regarding CGM: real promise for personalizing lifestyle interventions and flagging at-risk metabolic phenotypes, but evidence that it changes hard cardiovascular outcomes, heart attacks, strokes, is still limited. Surrogate markers move. Whether that translates into fewer people ending up in a cardiac ward has not been demonstrated.
There's also a psychological cost. Glucose variability data can motivate real behavior change, but it can just as easily generate anxiety over a reading that sits well within normal biological variation. Context determines which outcome you get. And regulators have drawn a clear line here: Abbott's Lingo carries FDA clearance explicitly for wellness purposes, not for diabetes management or diagnosis. CGM, for a healthy adult, is not cleared as a diagnostic device, and it shouldn't be treated like one.
The consumer devices now making CGM accessible without a prescription
The FDA cleared the first over-the-counter CGM, Dexcom's Stelo, in March 2024. By June of that year, three OTC CGMs had cleared FDA review, opening a market that had previously required a prescription and, in most cases, an existing diabetes diagnosis.
Stelo became available in the US starting August 26, 2024, aimed at adults who aren't on insulin. Pricing runs $99 for a pack of two sensors, covering up to 30 days of wear, or $89 a month on subscription for the same two-sensor pack, a 10% discount. The device is HSA and FSA eligible. Its feature set includes spike alerts, time-in-range goal tracking, and meal and activity logging. Dexcom added generative AI insights to the companion app in December 2024, and followed that in July 2025 with AI-powered photo meal logging. Stelo's MARD is 8.3%. Dexcom indicated it expected roughly $40 million in Stelo-related sales by the end of 2024.
Abbott's Lingo cleared the FDA in June 2024 and went on sale in the US in September that year. It's built explicitly for people without diabetes and, notably, is not cleared as a diabetes management device at all. Pricing runs $49 for a single 14-day sensor, $89 for a two-sensor pack, and $249 for six sensors. Its MARD is 9.3%. Abbott has said it plans to expand the platform with additional biomarkers down the line, including ketones and lactate, and potentially alcohol. Separately, Abbott's FreeStyle Libre 3 is the subject of an August 2022 partnership with WeightWatchers focused on diabetes management and weight loss. The device is aimed at people living with diabetes.
The broader hardware trend is moving toward all-in-one patch sensors that combine the sensor, transmitter, and memory into a single adhesive unit, cutting down on the separate components earlier CGM generations required. Non-invasive systems, like GlucoRx's multi-sensor platform, and wearables like the K'Watch are in development, though most of these remain in clinical trials rather than on shelves. The OTC CGM market itself was sized in the hundreds of millions of dollars in 2025 and is projected to grow to a figure in the billions by 2035, a 17.1% compound annual growth rate that makes it the fastest-growing segment of the broader CGM category.
Reading your own CGM data without over- or under-interpreting it
Patterns across days reveal what a single spike cannot, such as the same reading recurring every time you eat a particular meal or skip a... A reading above 180 mg/dL on a Tuesday afternoon tells you almost nothing in isolation. What tells you something is noticing that the same reading appears every time you eat a particular meal, skip a workout, or sleep less than six hours.
Pay attention to the arrow as well as the number. A glucose of 140 mg/dL that's falling steadily is a different physiological state than 140 mg/dL climbing fast, even though the raw value is identical. Richardson's proposed ±2 mg/dL per minute reference gives a rough sense of what counts as a fast change versus an ordinary one.
The anaerobic exercise spike deserves specific mention, because it's the one pattern most likely to alarm someone unfamiliar with the underlying physiology. A sharp glucose rise during or right after a heavy lift or a sprint interval is a normal catecholamine-driven response.
Stress is a real confound, not statistical noise. The TSST data from the CGM-HYPE study confirms that a stressful afternoon can produce a glucose pattern that looks, on paper, like it came from a carb-heavy lunch. Anyone reviewing their own trace should ask what else was happening that day, beyond what they ate.
Sensor error cuts in both directions. Readings at the extreme ends of the range, whether very high or very low, deserve a bit more skepticism, particularly during periods of rapid change, given that MARD figures in the high single digits mean a reading can be meaningfully off from the true blood glucose value.
Used well, CGM is a learning tool. It teaches a person how their own body responds to a specific food, a specific workout, a bad night's sleep. It does not replace a clinical workup, and it isn't approved to diagnose metabolic disease in someone who is otherwise healthy. If a pattern persists, consistently high time above range, poor overnight numbers, or a recovery time to baseline that stays unusually slow after ordinary meals, bring it to a clinician. It's not something to self-diagnose or self-treat off the back of a glucose graph alone.
Sources
- Continuous Glucose Monitoring under standardised conditions regarding diet, exercise and stress in Healthy Young People (CGM-HYPE study): An exploratory clinical trial
- Use of Continuous Glucose Monitoring in Non-diabetic Individuals for Cardiovascular Prevention: A Systematic Review of Its Impact on Guiding Lifestyle Interventions
- Defining Continuous Glucose Monitor Time in Range in a Large, Community-Based Cohort Without Diabetes | The Journal of Clinical Endocrinology & Metabolism | Oxford Academic
- researchgate.net
- gminsights.com